Lines
A classic map built from lines
The pulse of an airport
This is one simulated day at an airport. Every corridor is drawn as wide as the number of people walking it: tan for passengers walking in from the doors to their gate, black for passengers walking out through baggage claim. Press play and watch the building breathe.
Minard, indoors
In 1869 Charles Joseph Minard drew Napoleon's march on Moscow as a single band. Its width is the size of the army: tan on the way in, black on the way back, thinner after every battle. Edward Tufte called it possibly the best statistical graphic ever drawn. One look tells you how many, where and when.
Buildings suit this even better than open country. People move through a fixed network of corridors, escalators and lifts, and they pour in and peel off at the same places every day. An airport is the clearest case: everyone leaving goes through security, then splits pier by pier and thins out at every gate.
Why I'm drawing this
I've been exploring route analytics on indoor maps for a while: using the routes people take through a venue to show its pulse. The wayfinding map already knows every corridor and every way between floors. Add where people are going, and a map like this answers the questions venue teams ask:
- When does the morning wave hit security, and how long does it last?
- Which corridors carry the load at 17:30, and where do arriving and departing passengers cross?
- Where would one more sign, one more lane or one more person on shift help most?
The same questions come up in malls (which entrances feed which shops, and what sits on the busiest path) and in hospitals (how visitors reach clinics, and whether the step-free routes carry the load you'd expect).
One simulated day
Loading the Mappedin map…
How it's made
The building is real: Mappedin's demo airport, with its curbside doors, 82 gates, security checkpoints and baggage claims exactly where the venue data puts them. Departing passengers come in through a door of their terminal and go through security to their gate; arriving passengers walk from the gate through baggage claim and out the nearest door. Everyone takes the shortest walking route, through the real escalators, lifts and stairs.
What makes this possible is how flexible the Mappedin SDK is. The same map that gives a traveller turn-by-turn directions can be restyled completely: here it becomes a flat, top-down print on aged paper, with every terminal laid out on one sheet. Your own data goes right on top, in your own style, so the floor plan, the routes and the analytics live in one place. (Departures USA sits one level above the International pier, so it's drawn just below it.)
The flights are not real. They come from an invented schedule: 398 departures and 364 arrivals across the 82 gates, carrying 53,821 departing and 48,826 arriving passengers. Flights cluster in banks around 07:15, 11:30, 14:00, 17:45 and 21:00, on 737s, A220s, Dash 8s and E175s, with 787s and 767s at the international gates, 70–90% full. Departing passengers reach security 60 to 120 minutes before their flight; arriving passengers take 10 to 20 minutes to get off the plane. Everyone walks at 1.3 m/s. At a real venue the schedule and routes would come from real data, and the map works the same way.
What to look for
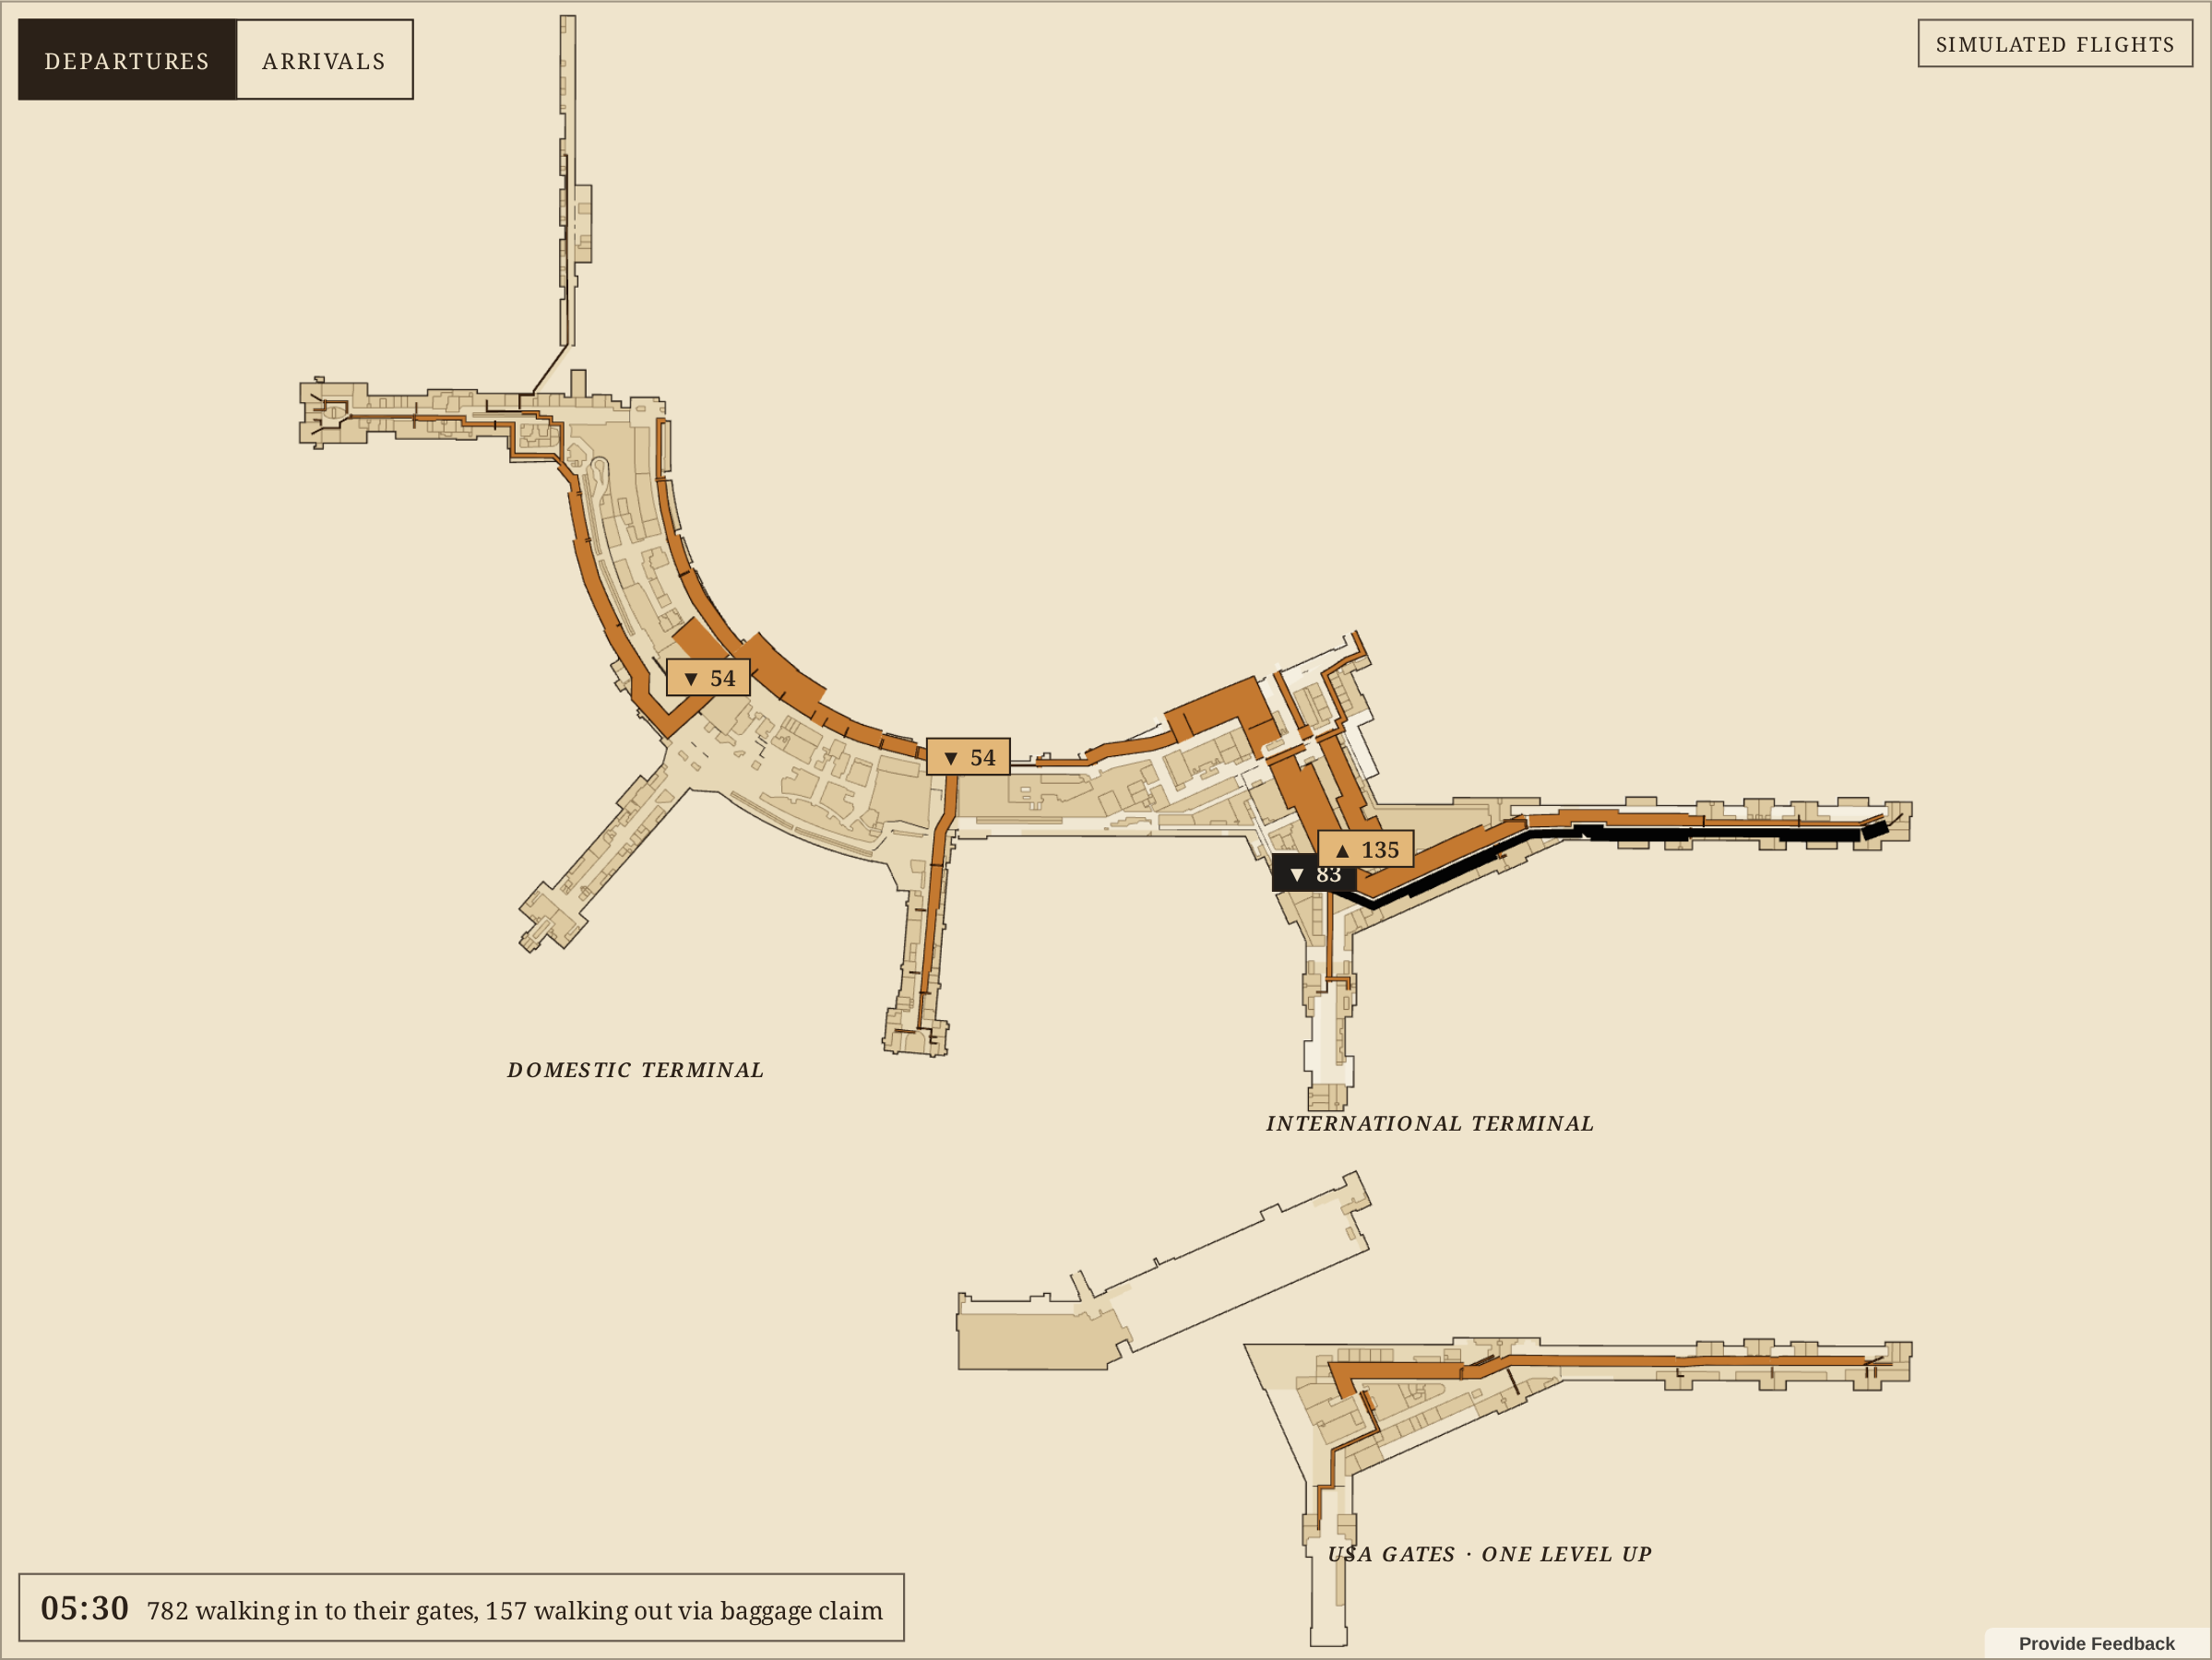
The dawn wave. The busiest hour through security is 05:00 to 06:00: 6,353 passengers heading for the first flights. At 05:30, 782 people are walking in to their gates and only 157 are on their way out. The tan bands gather from the doors, squeeze through security and split at every pier.
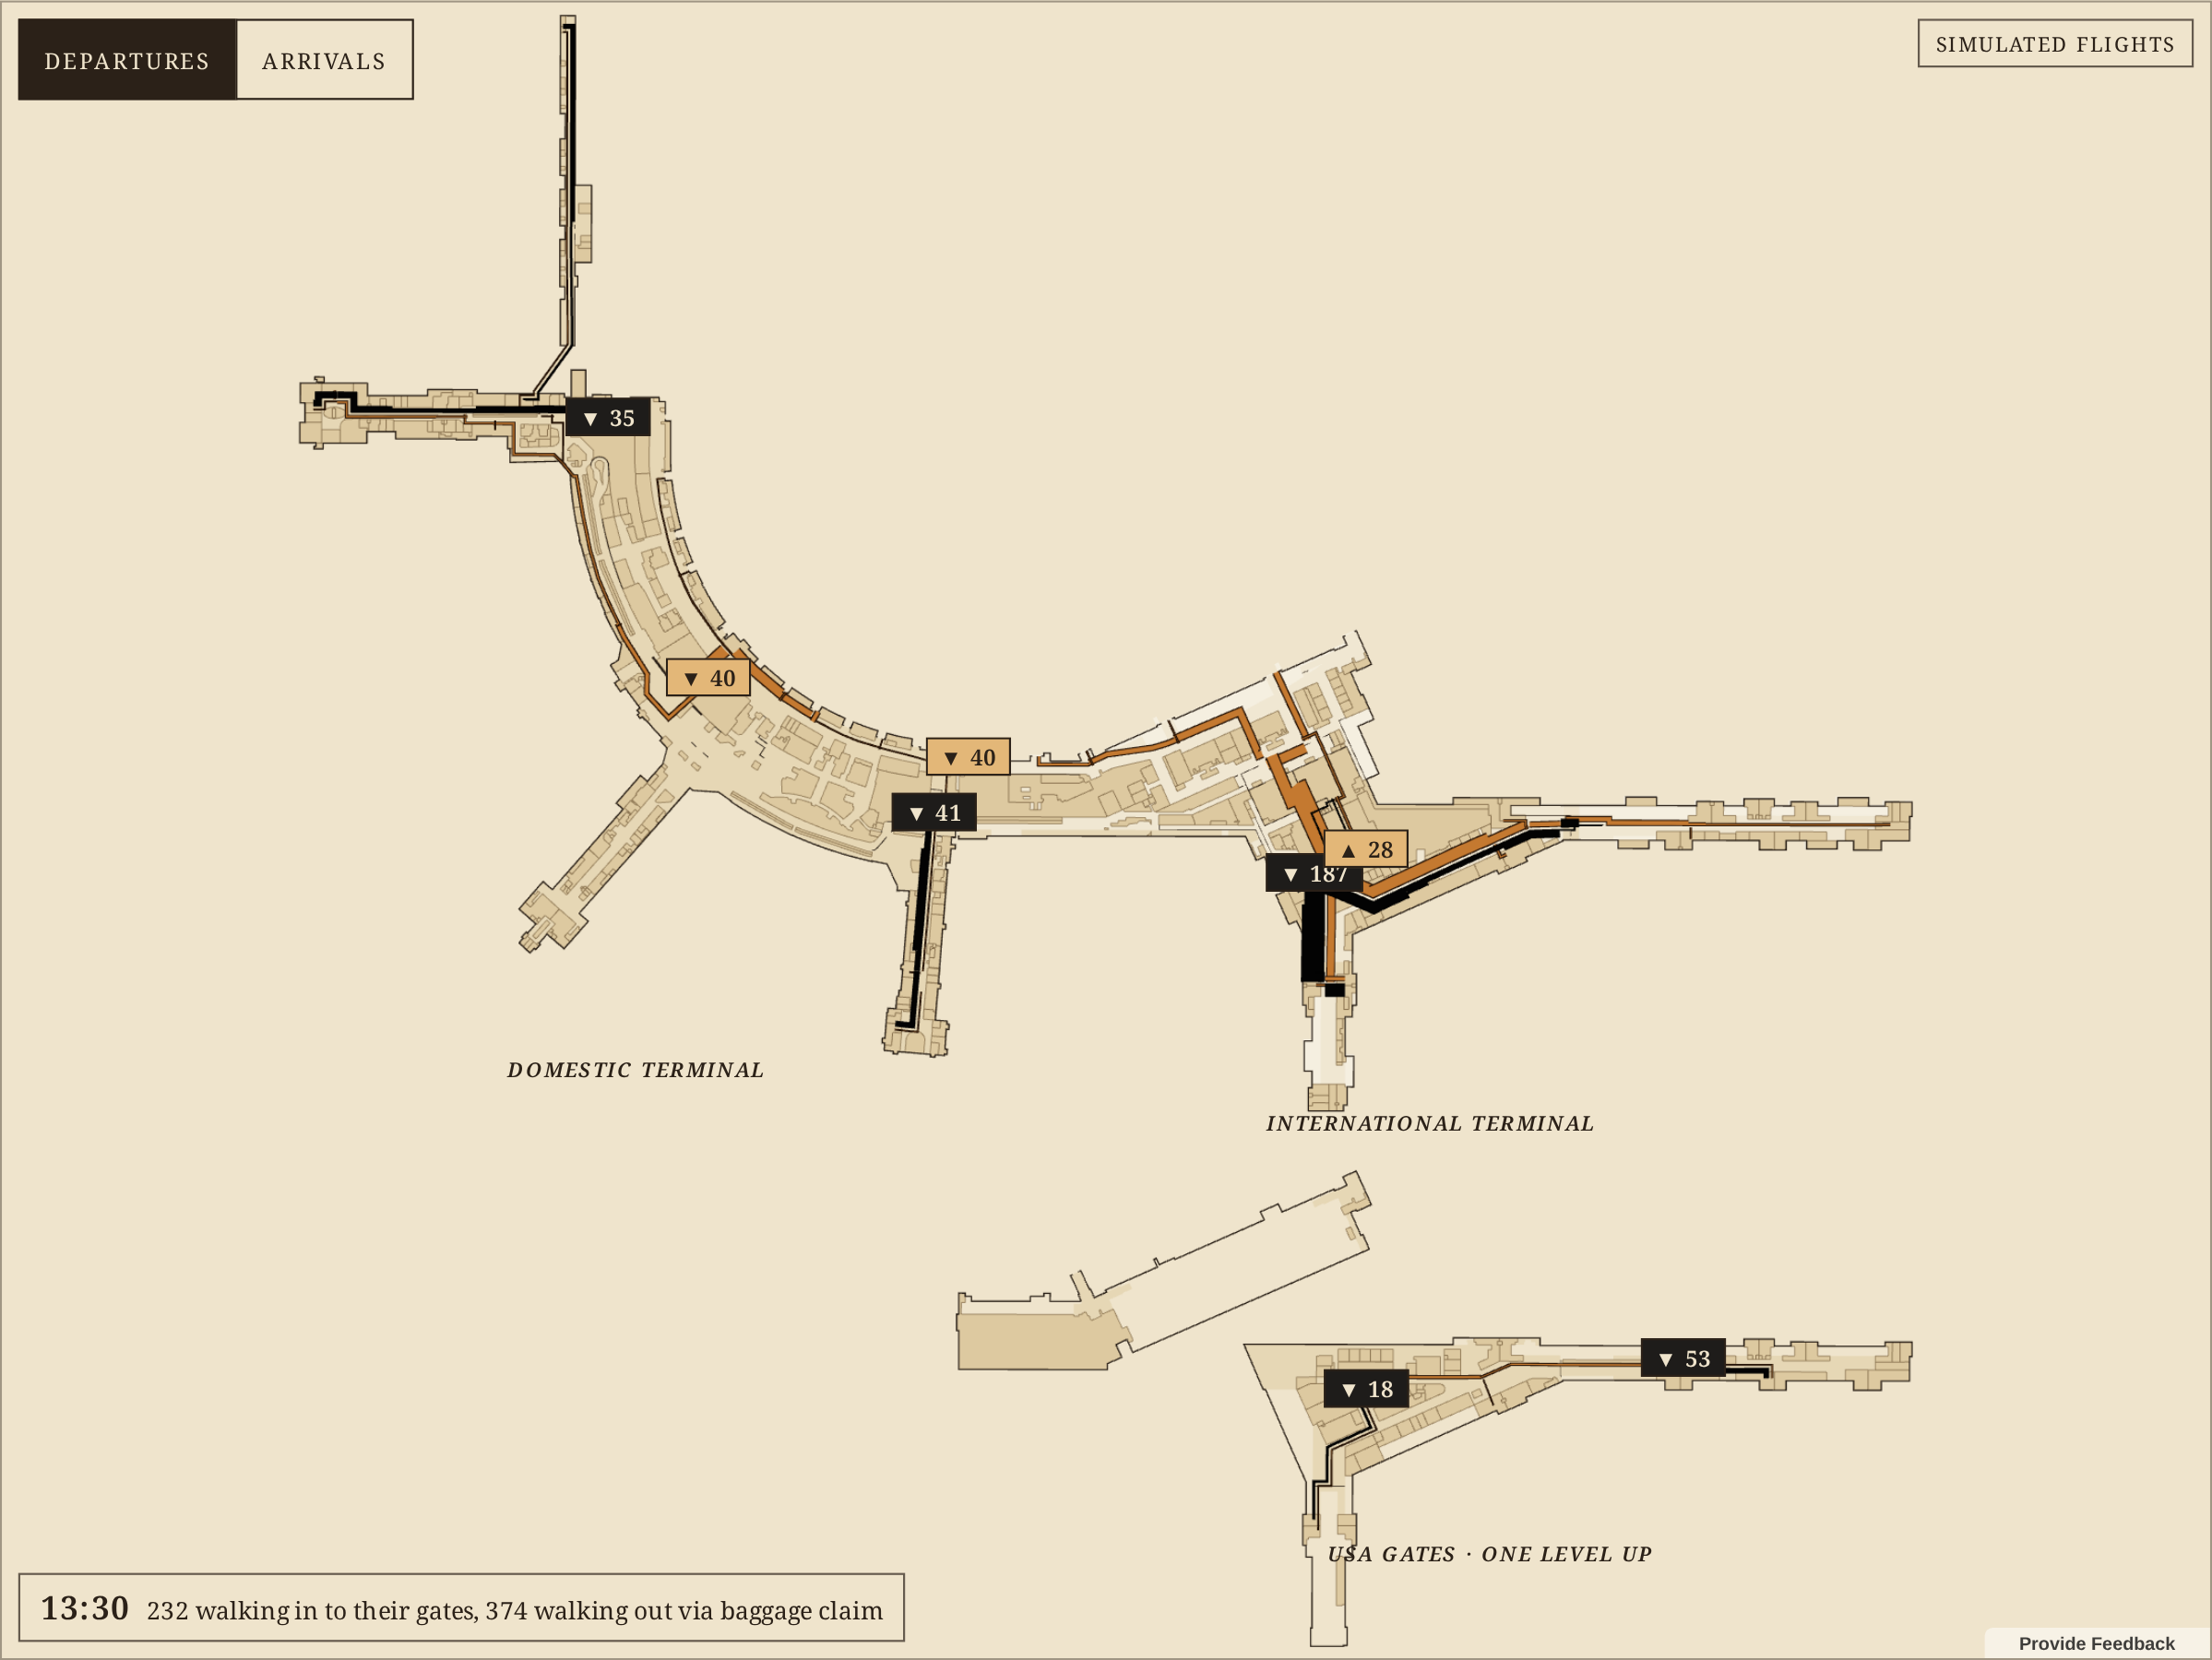
The midday lull. Security is quietest from 13:30, with 1,778 passengers that hour. The airport isn't: at 13:30 more people are walking out (374) than in to their gates (232), as the late-morning flights come in.
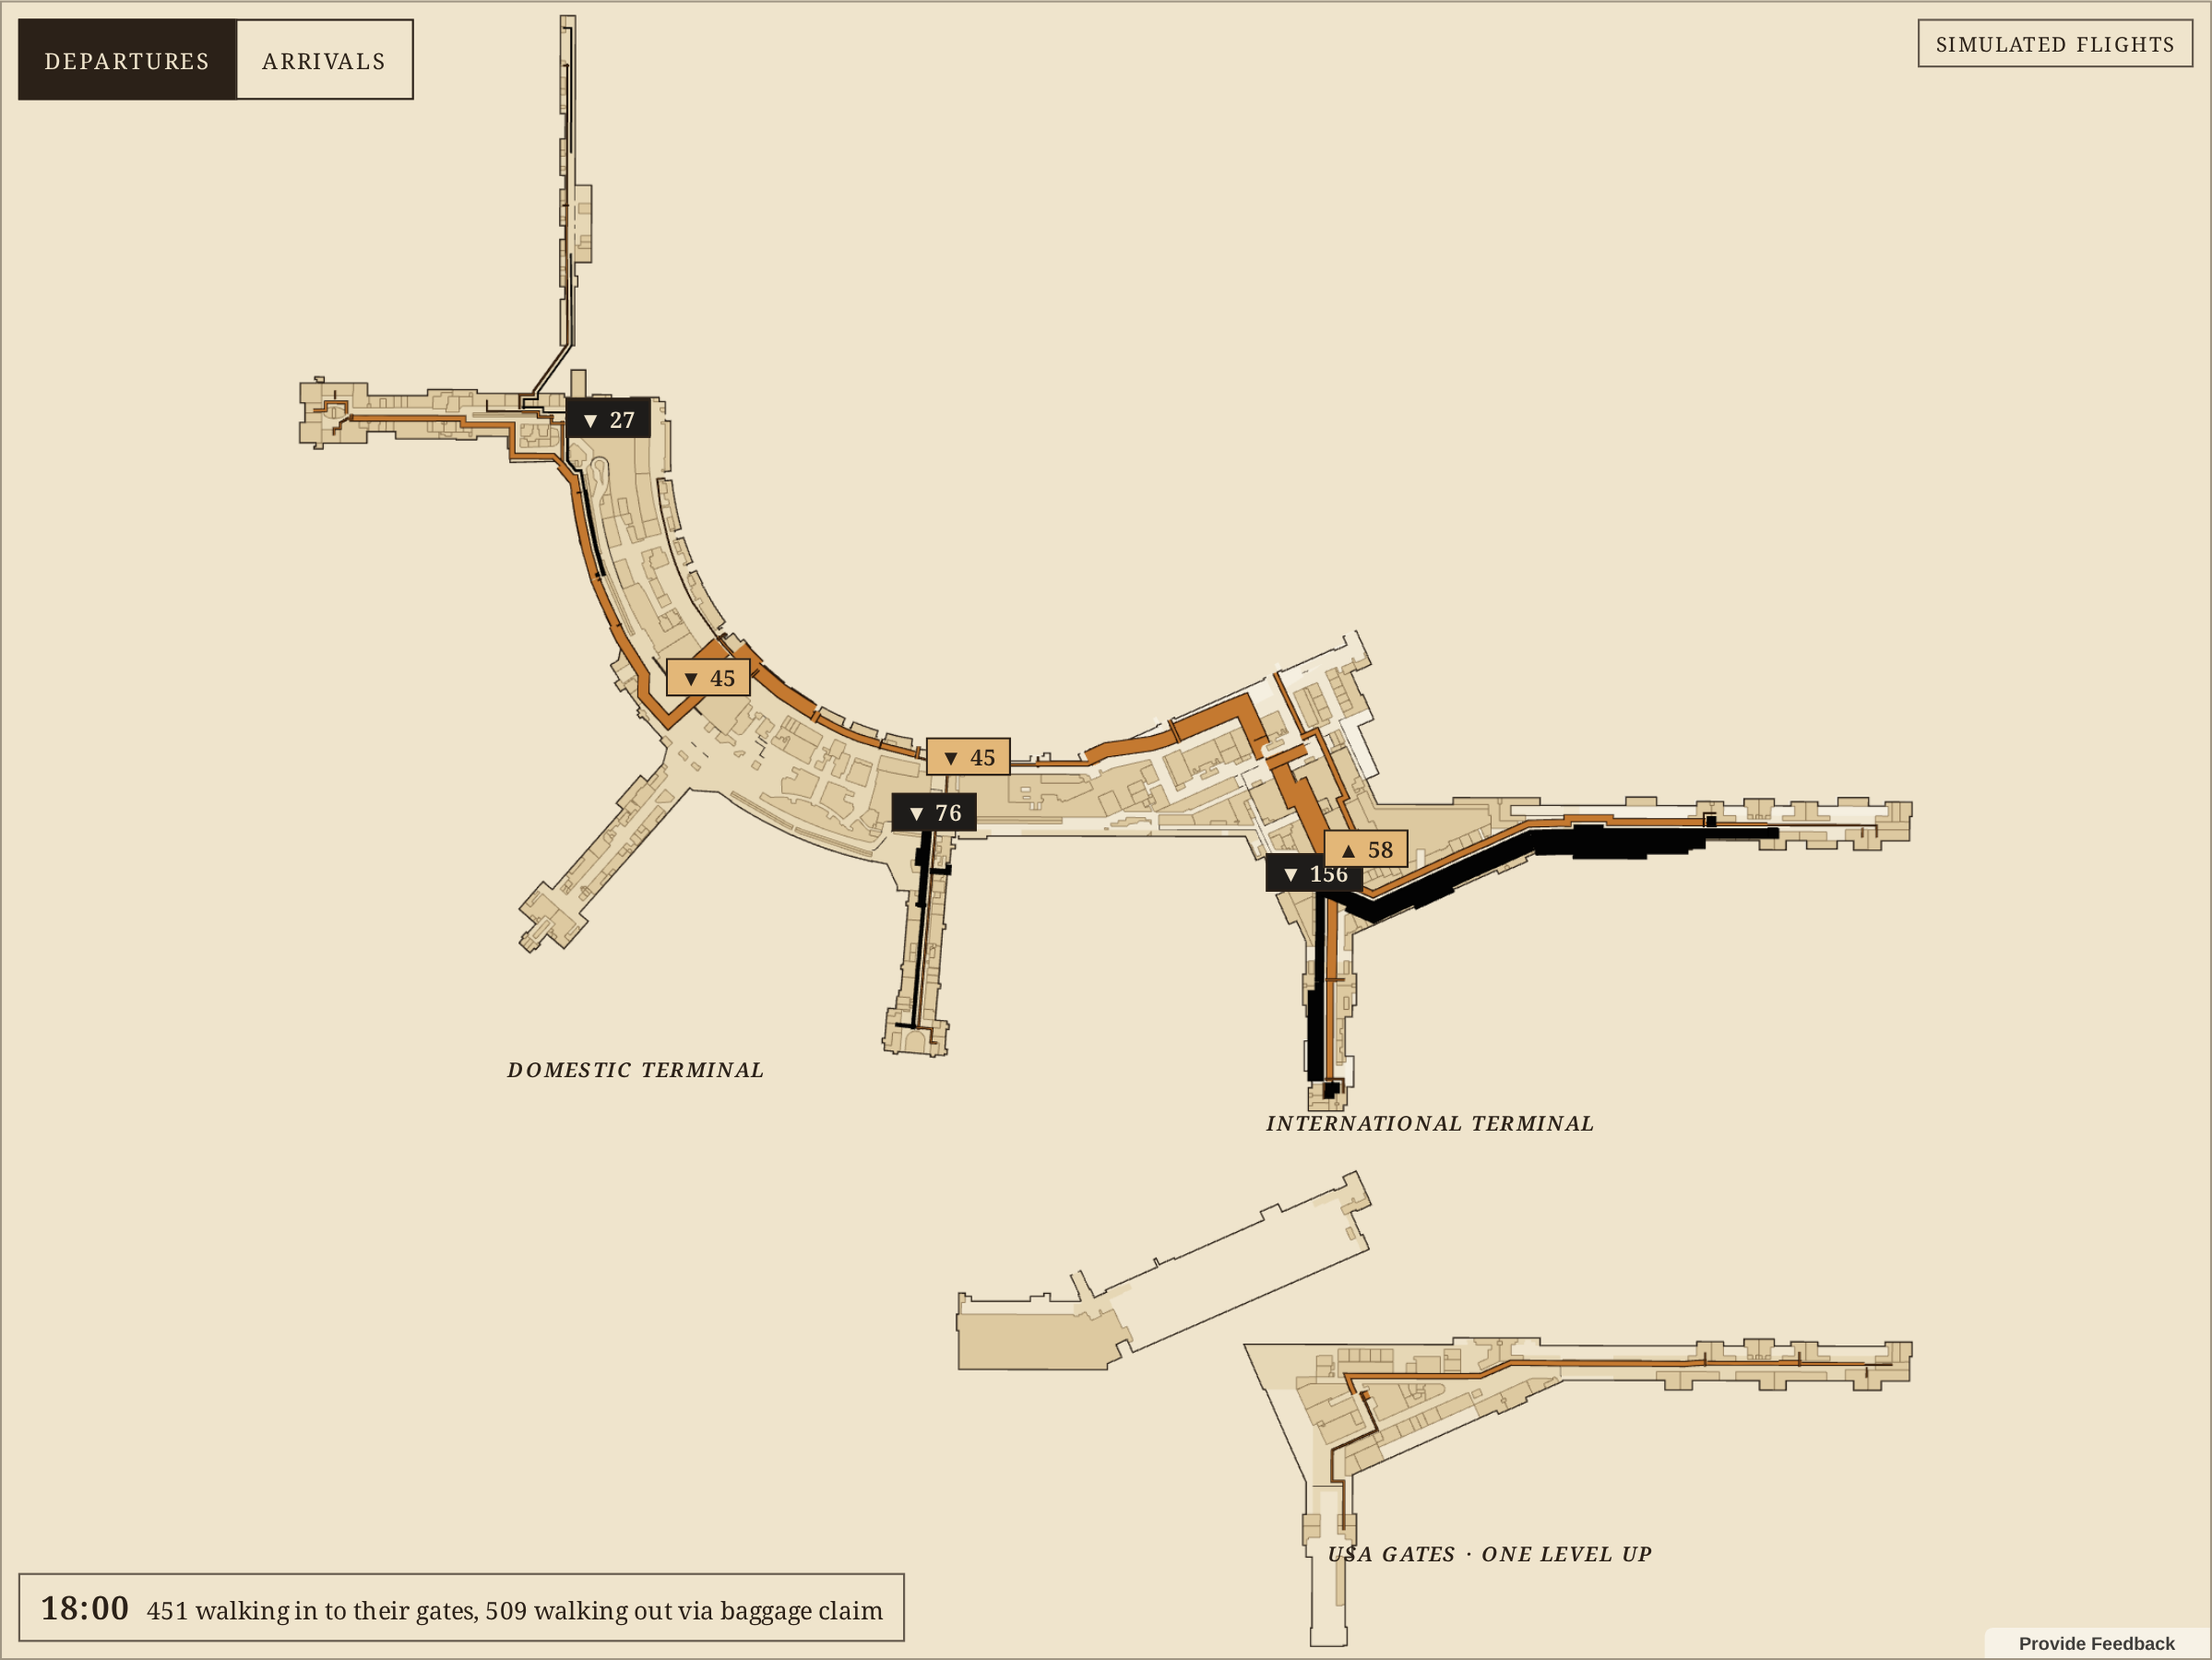
The evening crossover. At 18:00 both flows are heavy: 451 passengers walking in to their gates and 509 walking out. The two colours run side by side down the same corridors, like Minard's advance and retreat sharing a road. That's where a venue looks for crossing flows.
See your venue's pulse
Run an airport, a mall, a hospital or a campus? Talk to Mappedin about seeing yours like this, drawn from your own map and route data.
More maps from the month are in the #30DayMapChallenge 2026 gallery.